
// Modify here, bug causes nav to spill behind body on ultra large resolutions
In this guide you will be able to visualize the share of students who enroll and then persist into a second year of college based on high school, college type, and top-enrolling colleges.
The College-Going Pathways series is a set of guides, code, and sample data about policy-relevant college-going topics. Browse this and other guides in the series for ideas about ways to investigate student pathways through high school and college. Each guide includes several analyses in the form of charts together with Stata analysis and graphing code to generate each chart.
Once you’ve identified analyses that you want to try to replicate or modify, click the “Download” buttons to download Stata code and sample data. You can make changes to the charts using the code and sample data, or modify the code to work with your own data. If you’re familiar with Github, you can click “Go to Repository” and clone the entire College-Going Pathways repository to your own computer.
The data visualizations in the College-Going Pathways series use a synthetically generated college-going analysis sample data file which has one record per student. Each high school student is assigned to a ninth-grade cohort, and each student record includes demographic and program participation information, annual GPA and on-track status, high school graduation outcomes, and college enrollment information. The Connect guide (coming soon) will provide guidance and example code which will help you build a college-going analysis file using data from your own school system.
For many high school graduates, college enrollment is just the first of many hurdles on the road to postsecondary success. While considerable attention has been paid to challenges that surround college preparedness, access, and enrollment, only recently has conversation expanded to consider barriers to degree completion. These barriers must be understood and addressed at both the secondary and postsecondary levels for college attainment rates to increase. In the last section of the education pipeline, you examine patterns of persistence to the second year of college to identify early indications of student progress towards degree attainment.
One of the most important decisions in running each analysis is defining the sample. Each analysis corresponds to a different part of the education pipeline and as a result requires different cohorts of students.
If you are using the synthetic data we have provided, the sample restrictions have been predefined and are included below. If you run this code using your own agency data, change the sample restrictions based on your data. Note that you will have to run these sample restrictions at the beginning of your do file so they will feed into the rest of your code.
// Sample Restrictions

// Agency name
global agency_name "Agency"

// Ninth grade cohorts you can observe persisting to the second year of college
global chrt_ninth_begin_persist_yr2 = 2004
global chrt_ninth_end_persist_yr2 = 2006

// Ninth grade cohorts you can observe graduating high school on time
global chrt_ninth_begin_grad = 2004
global chrt_ninth_end_grad = 2006

// Ninth grade cohorts you can observe graduating high school one year late
global chrt_ninth_begin_grad_late = 2004
global chrt_ninth_end_grad_late = 2006

// High school graduation cohorts you can observe enrolling in college the fall after graduation
global chrt_grad_begin = 2007
global chrt_grad_end = 2009

// High school graduation cohorts you can observe enrolling in college two years after hs graduation
global chrt_grad_begin_delayed = 2007
global chrt_grad_end_delayed = 2009
Based on the sample data, you will have three cohorts (sometimes only two) for analysis. If you are using your own agency data, you may decide to aggregate results for more or fewer cohorts to report your results. This decision depends on 1) how much historical data you have available and 2) what balance to strike between reliability and averaging away information on recent trends. We suggest you average results for the last three cohorts to take advantage of larger sample sizes and improve reliability. However, if you have data for more than three cohorts, you may decide to not average data out for fear of losing information about trends and recent changes in your agency.
This guide is an open-source document hosted on Github and generated using the Stata Webdoc package. We welcome feedback, corrections, additions, and updates. Please visit the OpenSDP college-going pathways repository to read our contributor guidelines.
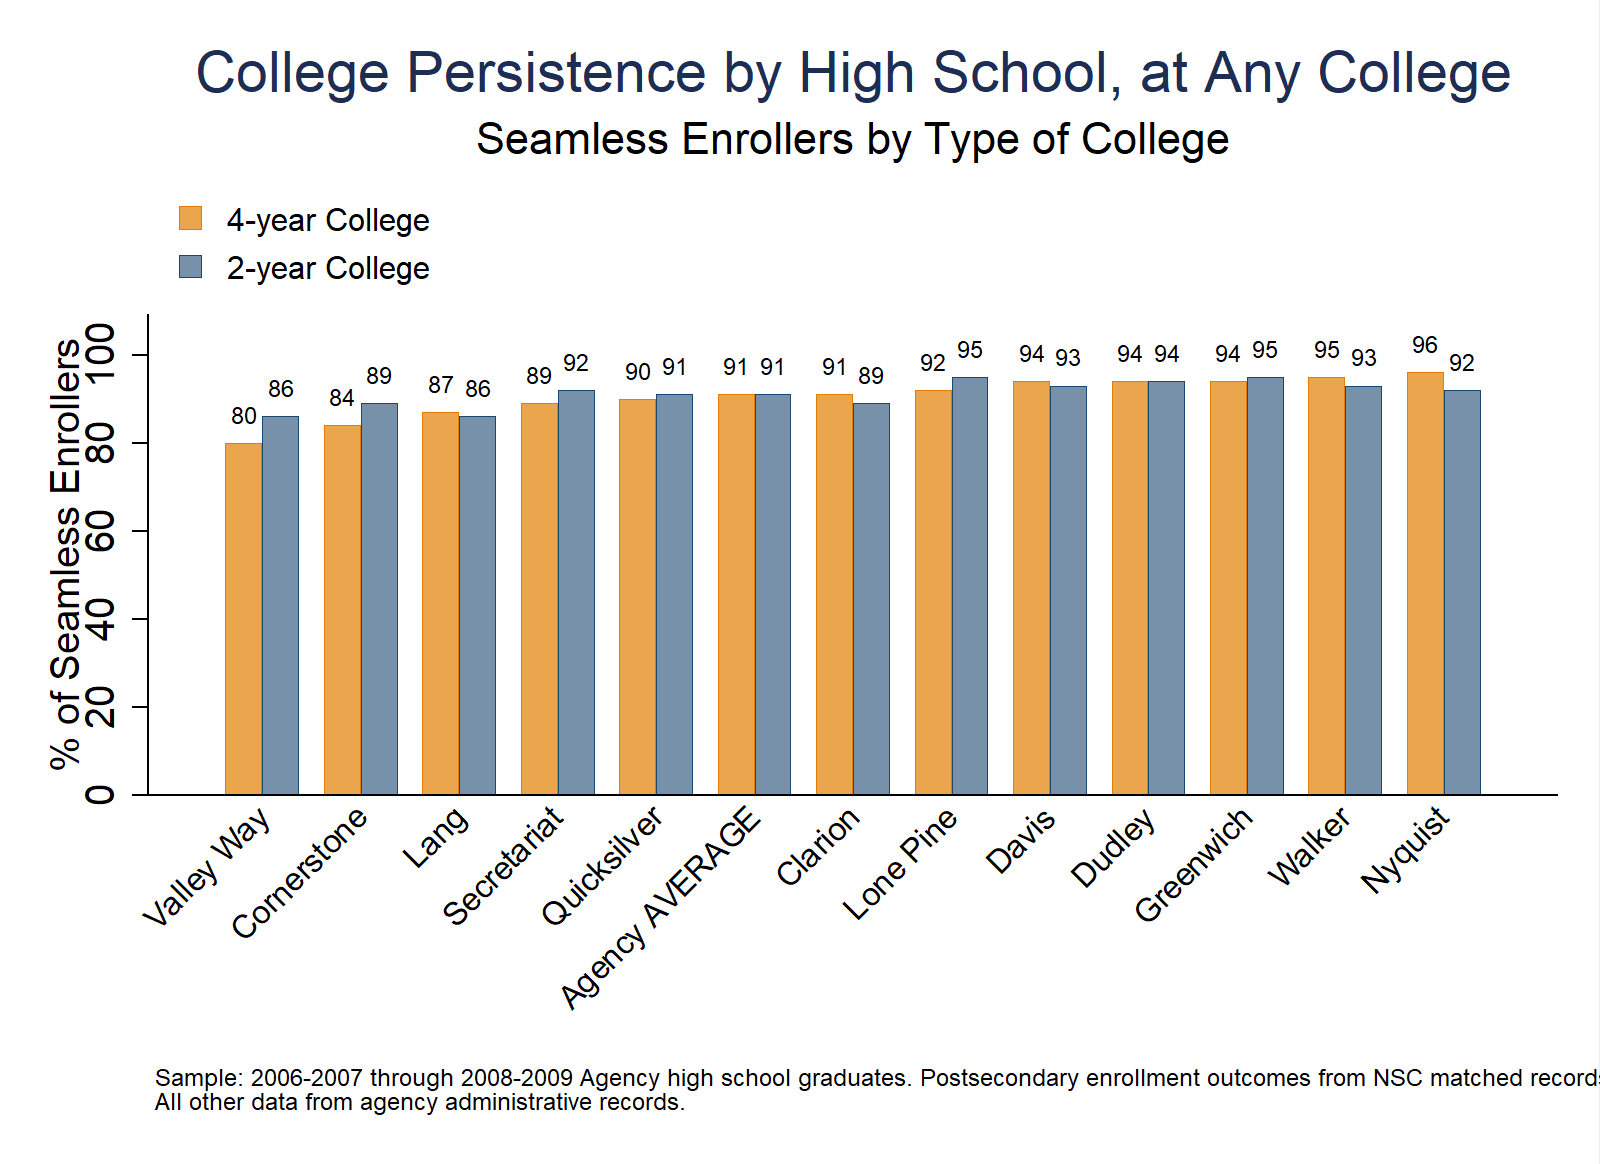
Purpose: Initial enrollment decisions can dramatically affect higher education trajectories and the likelihood of degree attainment. This analysis provides a snapshot of persistence to the second year of college by examining persistence rates across high schools in the system. The analysis illuminates differences in persistence by level of college first attended (two-year vs. four-year). Given another year of sample data, the analysis could also be conducted by time of initial entry (seamless vs. delayed enrollment).
Required Analysis File Variables:
sidenrl_1oct_grad_yr1_anyenrl_1oct_grad_yr1_4yrenrl_1oct_grad_yr1_2yrenrl_grad_persist_anyenrl_grad_persist_4yrenrl_grad_persist_2yrlast_hs_codelast_hs_nameenrl_ever_w2_grad_anyAnalysis-Specific Sample Restrictions:
Ask Yourself
Possible Next Steps or Action Plans: Consider establishing MOUs with local community colleges to obtain detailed data on graduates’ postsecondary pursuits at two-year colleges (Course enrollment and transcript data) allowing agencies to explore persistence rates by assignment to remediation coursework.
Analytic Technique: Calculate the proportion of students who persist to the second year of college by the high school those students first attended.
// Persistence Rates to the Second Year of College by High School

// Step 1: Load the college-going analysis file into Stata
use "$data/college_going_analysis", clear

// Step 2: Keep students in high school graduation cohorts you can observe enrolling in college the fall after graduation
local chrt_grad_begin = ${chrt_grad_begin}
local chrt_grad_end = ${chrt_grad_end}
keep if (chrt_grad >= `chrt_grad_begin' & chrt_grad <= `chrt_grad_end')

// Step 3: Rename outcome variable names for simplicity
rename enrl_grad_persist_any persist_any
rename enrl_grad_persist_2yr persist_2yr
rename enrl_grad_persist_4yr persist_4yr
rename enrl_1oct_grad_yr1_any enrl_any
rename enrl_1oct_grad_yr1_2yr enrl_2yr
rename enrl_1oct_grad_yr1_4yr enrl_4yr

// Step 4: Obtain the agency-level average for persistence and enrollment
preserve
    collapse (sum) persist_any enrl_4yr if enrl_4yr==1
    tempfile agency_level_4yr
    save `agency_level_4yr'
restore

preserve
    collapse (sum) persist_any enrl_2yr if enrl_2yr==1
    tempfile agency_level_2yr
    save `agency_level_2yr'
restore

// Step 5: Obtain the school-level average for persistence and enrollment
preserve
    collapse (sum) persist_any enrl_4yr if enrl_4yr==1, by(last_hs_code last_hs_name)
    tempfile school_level_4yr
    save `school_level_4yr'
restore

collapse (sum) persist_any enrl_2yr if enrl_2yr==1, by(last_hs_code last_hs_name)

// Step 6: Append on the previous agency-level and school-level files
append using `agency_level_4yr'
append using `agency_level_2yr'
append using `school_level_4yr'

// Step 7: Provide a hs name label for the agency average and shorten hs name
replace last_hs_code = 0 if last_hs_code == .
replace last_hs_name = "${agency_name} AVERAGE" if mi(last_hs_name)
replace last_hs_name = subinstr(last_hs_name, " High School", "", .)

// Step 8: Calculate percent persistence at 4-year and 2-year colleges and multiply outcomes of interest by 100 for graphical representation of the rates
gen pct_persist_any = persist_any / enrl_4yr
replace pct_persist_any = round((pct_persist_any * 100))
foreach type in 2yr 4yr {
    gen pct_persist_`type' = persist_any / enrl_`type'
    replace pct_persist_`type' = round((pct_persist_`type' * 100))
}

// Step 9: Drop any high schools with fewer than 20 students
drop if enrl_4yr < 20
drop if enrl_2yr < 20

// Step 10: Consolidate persistence data into single column and then reshape the data
gen n=2 if pct_persist_2yr~=.
replace n=4 if pct_persist_4yr~=.
replace pct_persist_4yr= pct_persist_2yr if pct_persist_4yr==.
keep last_hs_code last_hs_name pct_persist_4yr n
rename pct_persist_4yr pct_persist
reshape wide pct_persist, i(last_hs_name) j(n)

// Step 11: Prepare to graph the results
// Generate a cohort label to be used in the footnote for the graph
local temp_begin = `chrt_grad_begin'-1
local temp_end = `chrt_grad_end'-1
if `chrt_grad_begin'==`chrt_grad_end' {
    local chrt_label "`temp_begin'-`chrt_grad_begin'"
}
else {
    local chrt_label "`temp_begin'-`chrt_grad_begin' through `temp_end'-`chrt_grad_end'"
}

// Step 12: Graph the results
#delimit ;
graph bar pct_persist4 pct_persist2,
    over(last_hs_name, label(angle(45)labsize(small)) sort(pct_persist4)) bargap(0) outergap(100)
    bar(1, fcolor(dkorange) fi(inten70) lcolor(dkorange) lwidth(vvvthin))
    bar(2, fcolor(navy) fi(inten60) lcolor(navy) lwidth(vvvthin))
    blabel(total, position(outside) color(black) size(vsmall) format(%8.0f))
legend(label(1 "4-year College") label(2 "2-year College")
    position(11) ring(1) symxsize(2) symysize(2) rows(2) size(small) region(lstyle(none) lcolor(none) color(none)))
title("College Persistence by High School, at Any College")
    subtitle("Seamless Enrollers by Type of College")
    ytitle("% of Seamless Enrollers")
    yscale(range(0(20)100))
    ylabel(0(20)100, nogrid)
graphregion(color(white) fcolor(white) lcolor(white))
plotregion(color(white) fcolor(white) lcolor(white))
note(" " "Sample: `chrt_label' ${agency_name} high school graduates. Postsecondary enrollment outcomes from NSC matched records."
"All other data from agency administrative records.", size(vsmall));
#delimit cr

graph export "figures/E1_Persistence_by_HS.png", replace width(1600) height(1200)
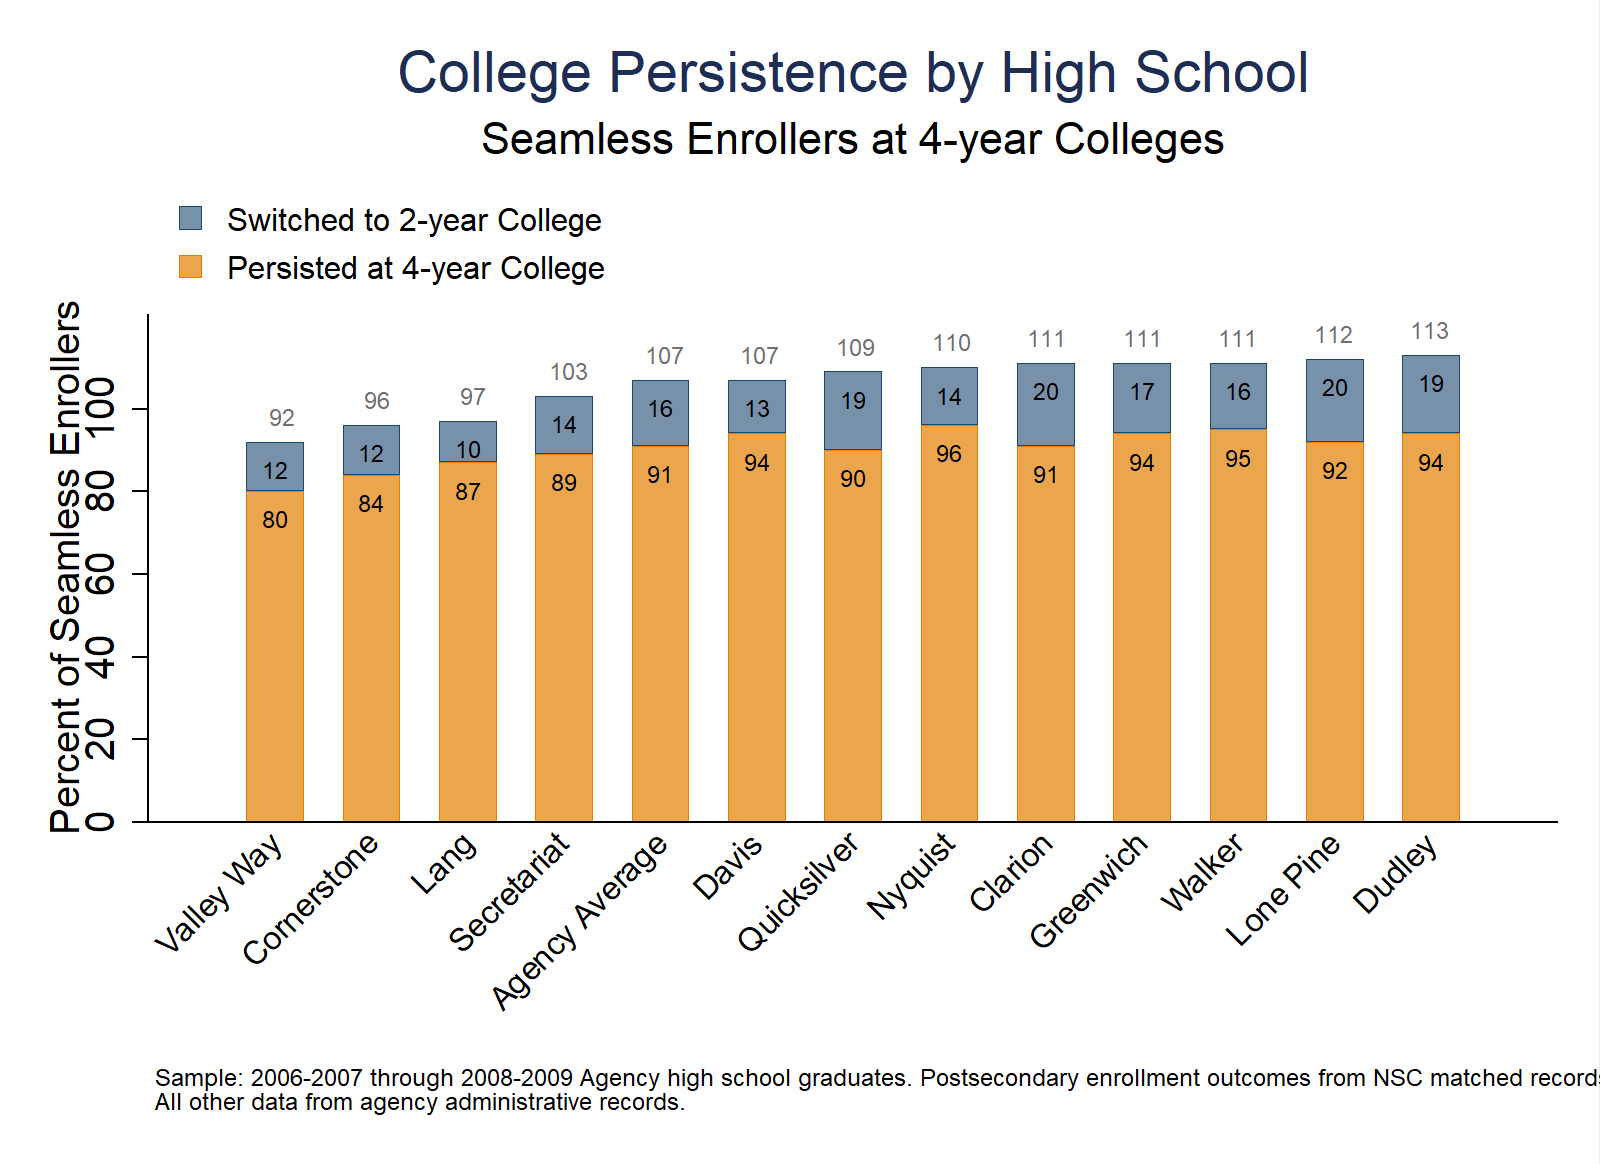
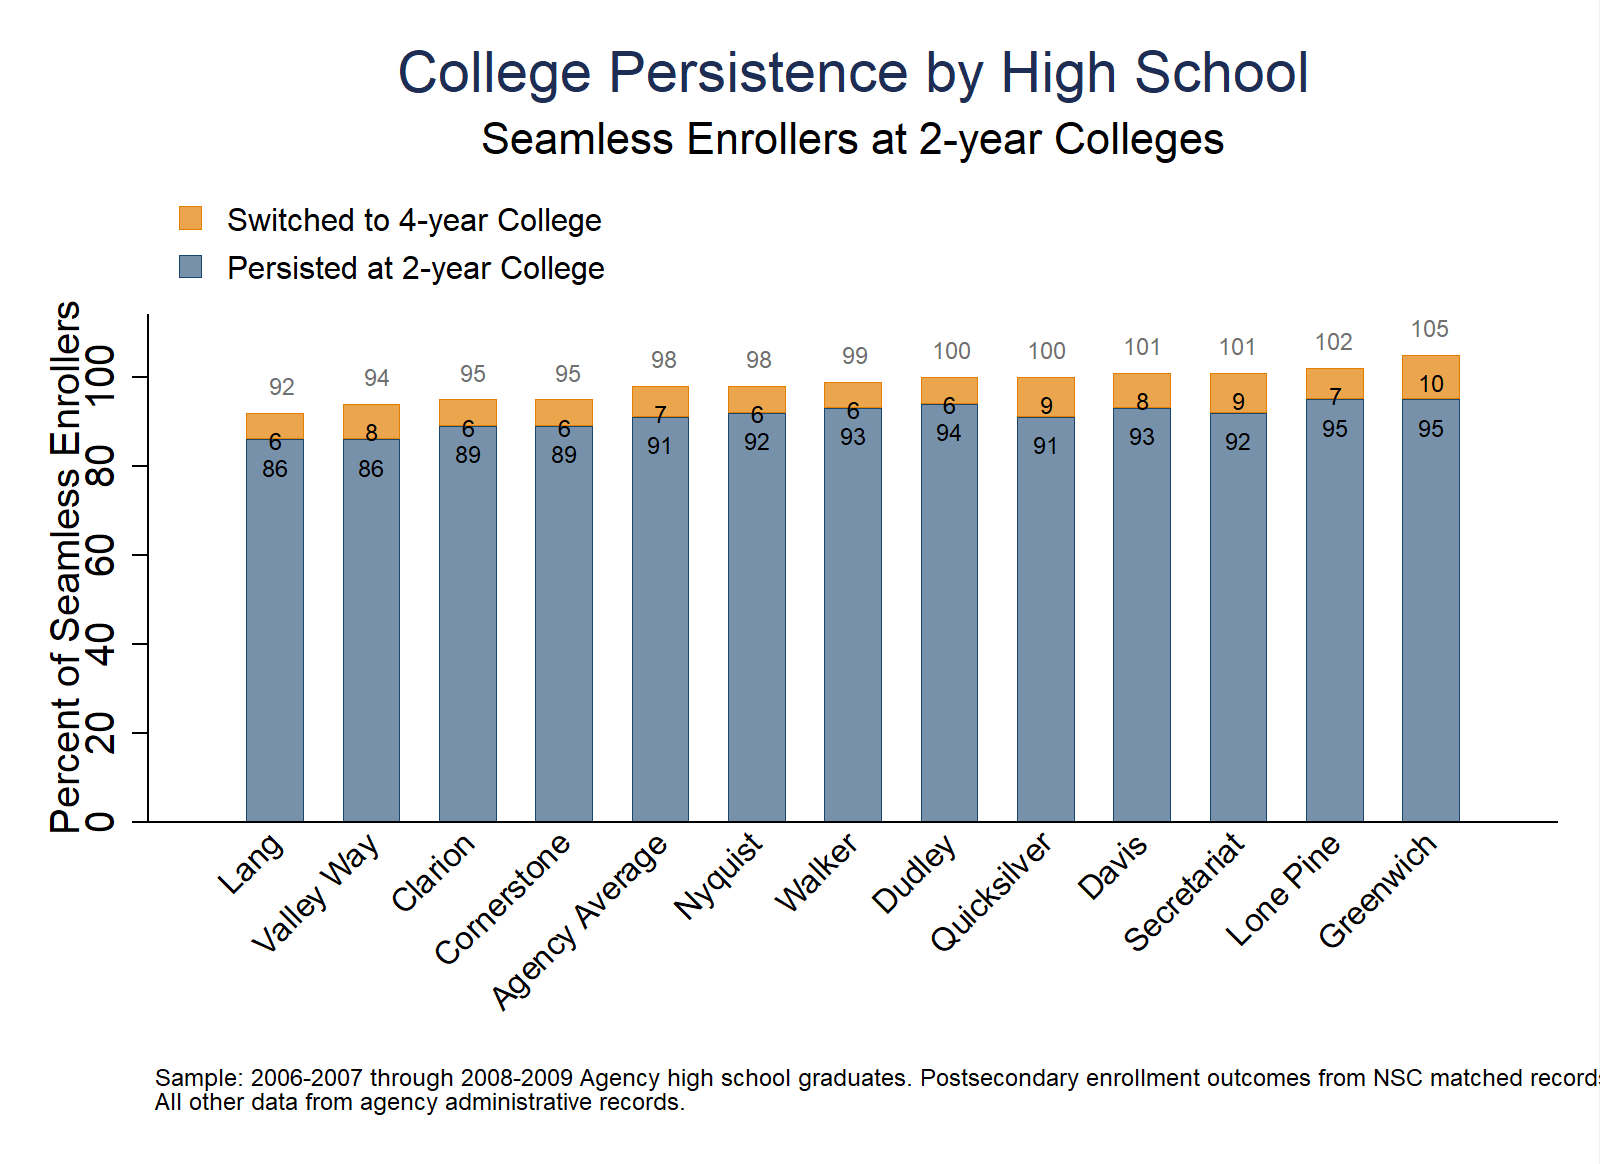
Purpose: This analysis provides a snapshot of persistence to the second year of college from one type of college to another for different high schools in the system. The left analysis charts explores how seamless enrollers in 4-year colleges either persist at a 4-year or switch to a 2-year. The right analysis charts how seamless enrollers in 2-year colleges either persist at a 2-year or switch to a 4-year.
Required Analysis File Variables:
sidenrl_1oct_grad_yr1_anyenrl_1oct_grad_yr1_4yrenrl_1oct_grad_yr1_2yrenrl_grad_persist_anyenrl_grad_persist_4yrenrl_grad_persist_2yrlast_hs_codelast_hs_nameAnalysis-Specific Sample Restrictions:
Ask Yourself
Possible Next Steps or Action Plans: Create individual school-level reports for administrators and college counselors to communicate which postsecondary institutions are associated with greater rates of persistence. Additionally, conduct similar analyses that include more detailed institutional information that may be associated with students’ prospects of persisting (e.g. cost of tuition and room/board, financial aid, etc.).
Analytic Technique: Calculate the proportion of 4-yr college-goers who persist through four years of college by the postsecondary institution first attended and cumulative high school GPA category.
// Persistence Across Two-Year and Four-Year Colleges

// Step 1:Load the college-going analysis file into Stata
use "$data/college_going_analysis", clear

// Step 2: Keep students in high school graduation cohorts you can observe enrolling in college the fall after graduation
local chrt_grad_begin = ${chrt_grad_begin}
local chrt_grad_end = ${chrt_grad_end}
keep if (chrt_grad >= `chrt_grad_begin' & chrt_grad <= `chrt_grad_end')

// Step 3: Rename outcome variable names for simplicity
rename enrl_grad_persist_2yr persist_2yr
rename enrl_1oct_grad_yr1_2yr enrl_2yr
rename enrl_grad_persist_4yr persist_4yr
rename enrl_1oct_grad_yr1_4yr enrl_4yr

// Step 4: Create binary outcomes for enrollers who switch from 4-yr to 2-yr, or vice versa
gen persist_4to2yr = (enrl_4yr == 1 & enrl_1oct_grad_yr2_2yr == 1) if !mi(chrt_grad)
gen persist_2to4yr = (enrl_2yr == 1 & enrl_1oct_grad_yr2_4yr == 1) if !mi(chrt_grad)

// Step 5: Obtain the agency-level average for the different persistence outcomes
preserve
    collapse (sum) persist_4yr persist_4to2yr enrl_4yr persist_2yr persist_2to4yr enrl_2yr
    tempfile agency_level
    save `agency_level'
restore

// Step 6: Obtain the school-level average for the different persistence outcomes
collapse (sum) persist_4yr persist_4to2yr enrl_4yr persist_2yr persist_2to4yr enrl_2yr, by(last_hs_code last_hs_name)
append using `agency_level'

// Step 7: Provide a hs name label for the agency average and shorten hs name
replace last_hs_name = "${agency_name} Average" if mi(last_hs_name)
replace last_hs_code = 0 if mi(last_hs_code)
replace last_hs_name = subinstr(last_hs_name, " High School", "", .)

// Step 8: Generate percentages for different persistence outcomes.  Multiply outcomes of interest by 100 for graphical representations of the rates
gen pct_persist_4yr = persist_4yr / enrl_4yr
gen pct_persist_4to2yr = persist_4to2yr / enrl_4yr
gen pct_persist_2yr = persist_2yr / enrl_2yr
gen pct_persist_2to4yr = persist_2to4yr / enrl_2yr

foreach var in pct_persist_2yr pct_persist_2to4yr pct_persist_4yr pct_persist_4to2yr {
    replace `var' = round((`var' * 100))
}

// Step 9: Create total persistence rates by summing up the other variables
gen total_persist_4yr = pct_persist_4yr + pct_persist_4to2yr
gen total_persist_2yr = pct_persist_2yr + pct_persist_2to4yr

//Step 10: Prepare to graph the results
// 1. Generate a cohort label to be used in the footnote for the graph
local temp_begin = `chrt_grad_begin'-1
local temp_end = `chrt_grad_end'-1
if `chrt_grad_begin'==`chrt_grad_end' {
    local chrt_label "`temp_begin'-`chrt_grad_begin'"
}
else {
    local chrt_label "`temp_begin'-`chrt_grad_begin' through `temp_end'-`chrt_grad_end'"
}
// 2. Generate graphing code to place value labels for the total persistence rates; change xpos (the position of the first leftmost label) and xposwidth (the horizontal width of the labels) to finetune.
foreach yr in 4 2 {
    sort total_persist_`yr'yr
    local total_persist_`yr'yr ""
    local num_obs = _N
    foreach n of numlist 1/`num_obs' {
    local temp_total_persist_`yr'yr = total_persist_`yr'yr in `n'
    local total_persist_`yr'yr `"`total_persist_`yr'yr' `temp_total_persist_`yr'yr'"'
    }
    local total_persist_`yr'yr_label ""
    local xpos = 7
    local xposwidth = 93.5
    foreach val of local total_persist_`yr'yr {
    local val_pos = `val' + 6
    local total_persist_`yr'yr_label `"`total_persist_`yr'yr_label' text(`val_pos' `xpos' "`val'", size(2.1) color(gs7))"'
    local xpos = `xpos' + `xposwidth'/_N
    }
    disp `"`total_persist_`yr'yr_label'"'
}

// Step 11: Graph the results (1/2) for seamless enrollers at 4-year colleges
#delimit ;
graph bar pct_persist_4yr pct_persist_4to2yr if enrl_4yr >= 20,
    over(last_hs_name, label(angle(45)labsize(small)) sort(total_persist_4yr)) bargap(0) outergap(100)
    bar(1, fcolor(dkorange) fi(inten70) lcolor(dkorange) lwidth(vvvthin))
    bar(2, fcolor(navy) fi(inten60) lcolor(navy) lwidth(vvvthin)) stack
    blabel(bar, position(inside) color(black) size(vsmall) format(%8.0f))
legend(label(1 "Persisted at 4-year College") label(2 "Switched to 2-year College")
    position(11) order(2 1) ring(1) symxsize(2) symysize(2) rows(2) size(small) region(lstyle(none) lcolor(none) color(none)))
title("College Persistence by High School")
    subtitle("Seamless Enrollers at 4-year Colleges")
    `total_persist_4yr_label'
    ytitle("Percent of Seamless Enrollers")
    yscale(range(0(20)100))
    ylabel(0(20)100, nogrid)
graphregion(color(white) fcolor(white) lcolor(white))
plotregion(color(white) fcolor(white) lcolor(white))
note(" " "Sample: `chrt_label' ${agency_name} high school graduates. Postsecondary enrollment outcomes from NSC matched records."
"All other data from agency administrative records.", size(vsmall));
#delimit cr

graph export "figures/E2a_Persistence_4yr_Seamless_Enrlers.png", replace width(1600) height(1200)

// Step 12: Graph the results (1/2) for seamless enrollers at 2-year colleges
#delimit ;
graph bar pct_persist_2yr pct_persist_2to4yr if enrl_4yr >= 20,
    over(last_hs_name, label(angle(45)labsize(small)) sort(total_persist_2yr)) bargap(0) outergap(100)
    bar(1, fcolor(navy) fi(inten60) lcolor(navy) lwidth(vvvthin))
    bar(2, fcolor(dkorange) fi(inten70) lcolor(dkorange) lwidth(vvvthin)) stack
    blabel(bar, position(inside) color(black) size(vsmall) format(%8.0f))
legend(label(2 "Switched to 4-year College") label(1 "Persisted at 2-year College")
    position(11) order(2 1) ring(1) symxsize(2) symysize(2) rows(2) size(small) region(lstyle(none) lcolor(none) color(none)))
title("College Persistence by High School")
    subtitle("Seamless Enrollers at 2-year Colleges")
    `total_persist_2yr_label'
    ytitle("Percent of Seamless Enrollers")
    yscale(range(0(20)100))
    ylabel(0(20)100, nogrid)
graphregion(color(white) fcolor(white) lcolor(white))
plotregion(color(white) fcolor(white) lcolor(white))
note(" " "Sample: `chrt_label' ${agency_name} high school graduates. Postsecondary enrollment outcomes from NSC matched records."
"All other data from agency administrative records.", size(vsmall));
#delimit cr

graph export "figures/E2b_Persistence_2yr_Seamless_Enrlers.png", replace width(1600) height(1200)
Purpose: This analysis reports enrollment and persistence rates among top-enrolling two- and four- year institutions attended by graduates. This analysis illuminates differences in persistence rates to the second year of college among top-enrolling postsecondary institutions. Agency staff that advise students during their senior year may find this information useful when meeting to weigh college options.
Required Analysis File Variables:
sidenrl_1oct_grad_yr1_anyenrl_1oct_grad_yr1_4yrenrl_1oct_grad_yr1_2yrenrl_grad_persist_anyenrl_grad_persist_4yrenrl_grad_persist_2yrfirst_college_name_anyfirst_college_name_2yrfirst_college_name_4yr** Analysis-Specific Sample Restrictions:**
Ask Yourself
Analytic Technique: Calculate the proportion of college-goers attending top-enrolling 2- and 4-year institutions, as well as the proportion of seamless enrollers who persist to the second year of any college, by the postsecondary institution graduates first attended.
// Top-Enrolling Colleges/Universities of Agency Graduates

// Step 1: Load the college-going analysis file into Stata
use "$data/college_going_analysis", clear

// Step 2: Keep students in high school graduation cohorts you can observe enrolling in college the fall after graduation
local chrt_grad_begin = ${chrt_grad_begin}
local chrt_grad_end = ${chrt_grad_end}
keep if (chrt_grad >= `chrt_grad_begin' & chrt_grad <= `chrt_grad_end')

// Step 3: Indicate the number of top-enrolling institutions you would like listed
local num_inst = 5

// Step 4: Calculate the number and % of students enrolled in each college the fall after graduation,
// and the number and % of students persisting, by college type

// 1. Calculate for 4-year colleges
preserve

    collapse (sum) enrl_1oct_grad_yr1_4yr enrl_grad_persist_4yr, by(first_college_name_4yr)
    keep if !mi(first_college_name_4yr)
    egen total_enrolled = sum(enrl_1oct_grad_yr1_4yr)
    egen total_persisted = sum(enrl_grad_persist_4yr)
    gen pct_enrolled_college = round((enrl_1oct_grad_yr1_4yr / total_enrolled)*100, .1)
    gen pct_persist_college = round((enrl_grad_persist_4yr / enrl_1oct_grad_yr1_4yr)*100, .1)
    format pct* %3.1f
    rename enrl_1oct_grad_yr1_4yr enrl_1oct_grad_yr1
    rename enrl_grad_persist_4yr enrl_grad_persist
    rename first_college_name_4yr first_college_name
    gen type = "4yr"
    tempfile college_4yr
    save `college_4yr'

restore

// 2. Calculate for 2-year colleges, and append the information for 4-year colleges
collapse (sum) enrl_1oct_grad_yr1_2yr enrl_grad_persist_2yr, by(first_college_name_2yr)
keep if !mi(first_college_name_2yr)
egen total_enrolled = sum(enrl_1oct_grad_yr1_2yr)
egen total_persisted = sum(enrl_grad_persist_2yr)
gen pct_enrolled_college = round((enrl_1oct_grad_yr1_2yr / total_enrolled)*100, .1)
gen pct_persist_college = round((enrl_grad_persist_2yr / enrl_1oct_grad_yr1_2yr)*100, .1)
format pct* %3.1f
rename enrl_1oct_grad_yr1_2yr enrl_1oct_grad_yr1
rename enrl_grad_persist_2yr enrl_grad_persist
rename first_college_name_2yr first_college_name
gen type = "2yr"
append using `college_4yr'

// Step 5: Create Table 1 with all 2-year and 4-year colleges listed
preserve

    // 1. Create two observations, one for each college type
    local newrows = _N+2
    set obs `newrows'
    replace  type="2yr" if _n==_N-1
    replace  type="4yr" if _n==_N

    replace  first_college_name = "ALL 2-YEAR COLLEGES" if type=="2yr" & mi(first_college_name)
    replace  first_college_name = "ALL 4-YEAR COLLEGES" if type=="4yr" & mi(first_college_name)

    // 2. Populate the new observations
    foreach type in 2 4 {
        summ total_enrolled if type == "`type'yr"
        replace enrl_1oct_grad_yr1 = r(mean) if first_college_name=="ALL `type'-YEAR COLLEGES"
        summ total_persisted if type == "`type'yr"
        replace enrl_grad_persist = r(mean) if first_college_name=="ALL `type'-YEAR COLLEGES"
    }
    replace pct_enrolled_college = 100 if mi(pct_enrolled_college)

    // 3. Retain, reorder, and rename necessary variables
    keep first_college_name enrl_1oct_grad_yr1 enrl_grad_persist pct_enrolled_college pct_persist_college type
    order first_college_name enrl_1oct_grad_yr1 pct_enrolled_college enrl_grad_persist pct_persist_college type

    gen rank = (regexm(first_college_name, "ALL"))
    gsort -type rank -enrl_1oct_grad_yr1
    drop rank type

    rename first_college_name College_Name
    rename enrl_1oct_grad_yr1 Number_Enrolled
    rename pct_enrolled_college Percent_Enrolled
    rename enrl_grad_persist Number_Persisted
    rename pct_persist_college Percent_Persisted

    // 4. Outsheet Table 1 into a csv file
    outsheet using "${figures}/E3_Top_Enrl_Col_Institutions_Table_1.csv", comma replace

restore

// Step 6: Create Tables 2 and 3 with the number of institutions you wanted to list in Step 3 for 4-year (Table 2) and 2-year (Table 3) colleges, respectively
// 1. Identify the five top-enrolling 2- and 4-year institutions (5 based on the number you selected in step 3)
gsort type -pct_enrolled_college
gen rank_2yr = _n in 1/`num_inst'

gsort -type -pct_enrolled_college
gen rank_4yr = _n in 1/`num_inst'

// 2. Calculate the remaining proportion of students attending other 2- and 4-year colleges for purposes of populating the "Other" line (all other 2- and 4-year colleges beyond the number selected) in the table.
foreach type in 2yr 4yr {
    egen other_number_`type'_temp = sum(enrl_1oct_grad_yr1) if mi(rank_`type') & type=="`type'"
    egen other_number_`type' = max(other_number_`type'_temp)
    egen other_pct_`type'_temp = sum(pct_enrolled_college) if mi(rank_`type') & type=="`type'"
    egen other_pct_`type' = max( other_pct_`type'_temp)
    egen other_number_persist_`type'_temp = sum(enrl_grad_persist) if mi(rank_`type') & type=="`type'"
    egen other_number_persist_`type' = max(other_number_`type'_temp)
    drop *_temp
}

keep if !mi(rank_2yr) | !mi(rank_4yr)

// 3. Create four new rows, one per college type for total counts and one per college type for colleges other than the top-enrolling ones
local newrows = _N+4
set obs `newrows'
replace  type="2yr" if _n==_N-2 | _n==_N-3
replace  type="4yr" if _n==_N | _n==_N-1

replace first_college_name = "OTHER 2-YEAR COLLEGES" if type=="2yr" & mi(first_college_name) & _n==_N-3
replace first_college_name = "ALL 2-YEAR COLLEGES" if type=="2yr" & mi(first_college_name) & _n==_N-2
replace first_college_name = "OTHER 4-YEAR COLLEGES" if type=="4yr" & mi(first_college_name) & _n==_N-1
replace first_college_name = "ALL 4-YEAR COLLEGES" if type=="4yr" & mi(first_college_name) & _n==_N

// 4. Populate the new rows
foreach type in 2 4 {
    summ total_enrolled if type == "`type'yr"
    replace enrl_1oct_grad_yr1 = r(mean) if first_college_name=="ALL `type'-YEAR COLLEGES"
    summ total_persisted if type == "`type'yr"
    replace enrl_grad_persist = r(mean) if first_college_name=="ALL `type'-YEAR COLLEGES"
    summ other_number_`type'yr if type == "`type'yr"
    replace enrl_1oct_grad_yr1 = r(mean) if first_college_name=="OTHER `type'-YEAR COLLEGES"
    summ other_pct_`type'yr if type == "`type'yr"
    replace pct_enrolled_college = r(mean) if first_college_name=="OTHER `type'-YEAR COLLEGES"
    summ other_number_persist_`type'yr if type == "`type'yr"
    replace enrl_grad_persist = r(mean) if first_college_name=="OTHER `type'-YEAR COLLEGES"
}
replace pct_enrolled_college = 100 if mi(pct_enrolled_college)

// 5. Retain, reorder, and rename necessary variables
keep first_college_name enrl_1oct_grad_yr1 enrl_grad_persist pct_enrolled_college pct_persist_college type
order first_college_name enrl_1oct_grad_yr1 pct_enrolled_college enrl_grad_persist pct_persist_college type

gen rank = (regexm(first_college_name, "ALL"))
replace rank = 0.5 if regexm(first_college_name, "OTHER")
gsort -type rank -enrl_1oct_grad_yr1
drop rank

rename first_college_name College_Name
rename enrl_1oct_grad_yr1 Number_Enrolled
rename pct_enrolled_college Percent_Enrolled
rename enrl_grad_persist Number_Persisted
rename pct_persist_college Percent_Persisted

// 6. Outsheet Table 2 (4-year colleges) into a csv file
preserve
    keep if type=="4yr"
    drop type
    // This is what the csv looks like
    list * if _n <=5, table
    outsheet using "figures/E3_Top_Enrl_Col_Institutions_Table_2.csv", comma replace
restore

// 7. Outsheet Table 3 (2-year colleges) into a csv file
preserve
    keep if type=="2yr"
    drop type
    // This is what the csv looks like
    list * if _n <=5, table
    outsheet using "figures/E3_Top_Enrl_Col_Institutions_Table_3.csv", comma replace
restore